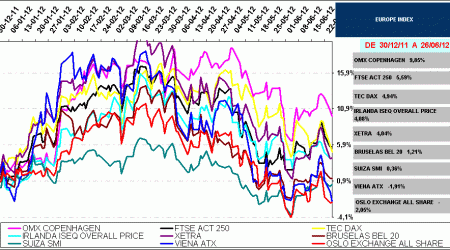
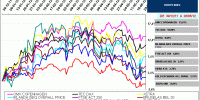
Graficos en base 100... 27 Jun 2012admin Emplearé gráficos en base 100 para seguir la evolución de una selección de los 18 índices … Leer
Graficos en base 100... 28 May 2012admin Emplearé gráficos en base 100 para seguir la evolución de una selección de los 18 índices … Leer
Graficos en base 100... 13 Mar 2013admin Emplearé gráficos en base 100 para seguir la evolución de una selección de los 18 índices burátiles más relevantes de Europa, tomando como referencia el … Leer
Graficos en base 100... 13 Mar 2013admin Emplearé gráficos en base 100 para seguir la evolución de una selección de los … Leer
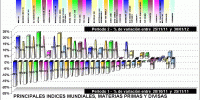
Performing Index, commodities, currencys.... 8 Mar 2013admin Analizamos como evolucionan una selección de los índices bursátiles mundiales … Leer
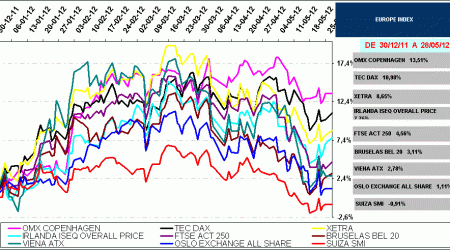
Graficos en base 100... 27 Jun 2012admin Emplearé gráficos en base 100 para seguir la evolución de una selección de los … Leer
Graficos en base 100... 28 May 2012admin Emplearé gráficos en base 100 para seguir la evolución de una selección de los … Leer
Europe Index, Eurostoxx sectors... 1 May 2012admin The tables below show the list of the best and worst performing stock index, … Leer
DJ Eurostoxx 50 Tables... 1 May 2012admin The tables below show the list of the best and worst performing stocks. The … Leer
Performing Index, commodities, currencys.... 30 Ene 2012admin Analizamos como evolucionan una selección de los índices bursátiles mundiales … Leer