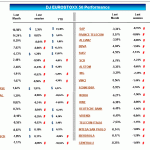
The tables below show the list of the best and worst performing stock index and commodities. We track stock index of 29 countries.

The first table shows last 5 sessions performance order stocks index hierarchy.
The first left column is ordered by last 5 sessions performance.
The table highlight the stocks index and commodities with positive return with $ symbol and with # symbol the stocks index and commodities with negative returns.
The table below show last month performance order stocks index and commodities hierarchy.
The first left column is ordered by last month performance.
Then next column show year to day (YTD) performance and the next last trimester performance.
At last, show histogram that hierarchy the index and commodities by last session performance.
.
Post comentarys at twitter account joseangelmena
.
.


