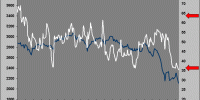
probabilidad de exito ibex 35

Curvas de probabilidad de...

Desde el 13 de mayo en el caso de Ibex 35 y desde el 11 de marzo en el de Eurostoxx 50, esta herramienta descendió por debajo del 50% de probabilidad de éxito para aquellos que mantuvieran una cartera montada al azar con activos de estos índices bursátiles. Desde esas fechas deberíamos haber reducido nuestra … Leer
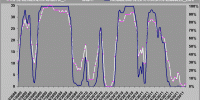
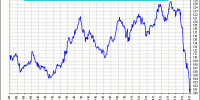
spread xetra vs ftse 100

Long short DAX XETRA...

El spread FTSE 100 vs DAX XETRA podemos emplearlo como indicador indirecto de tendencia en los mercados financieros. Spread al alza suele venir asociado con bolsas que se aprecian y spread a la baja suele estar correlacionado con bolsas que consolidan posiciones. El sesgo bajista en este spread es evidente y según la curva desvest … Leer

Imagen del artículo

Rango de trading en...

La tabla que tienen a continuación reune los 35 valores de Ibex 35 evolucionando dentro de su rango de trading más probable. Cálculos realizados sobre el rango de trading de las últimas 150 sesiones. Mantenemos la predisposición bajista, así que apostamos por que en unas cuantas sesiones, esta herramienta irá ubicando la mayoría de los … Leer

oscilador rv vs rf

Oscilador de RV vs...

Aún no se ha introducido este oscilador bajo el umbral 35 de lo que infiero que aún quedan descensos adicionales en las bolsas durante el mes de septiembre. Una vez sea perforado a la baja el umbral 35 tendremos que aguardar a que se rebase al alza para que se genere señal de entrada según … Leer

Imagen del artículo

Rango de trading en...

La tabla que tienen a continuación reune los 35 valores de Ibex 35 evolucionando dentro de su rango de trading más probable. Cálculos realizados sobre el rango de trading de las últimas 150 sesiones. Mantenemos la predisposición bajista, así que apostamos por que en unas cuantas sesiones, esta herramienta irá ubicando la mayoría de los … Leer

Imagen del artículo

Rango de trading en...

La tabla que tienen a continuación reune los 35 valores de Ibex 35 evolucionando dentro de su rango de trading más probable. Cálculos realizados sobre el rango de trading de las últimas 50 sesiones. Asumimos que la tendencia es bajista, así que vigilaremos esta herramienta ya que puede ayudarnos a avizorar el techo de posibles … Leer

Imagen del artículo

Eurostoxx 50 Trading Range...

Below is a table of the 50 stocks in the Eurostoxx 50. Highlight last month and last session % change and trading range frame. The stocks of DJ Eurostoxx 50 are ordered by sector and the table right columns are built with last 50 sessions standard deviations. If we think that the trend is down, … Leer

Imagen del artículo

Eurostoxx 50 trading range....

Below is a table of the 50 stocks in the Eurostoxx 50. Highlight year to day (YTD) and last session % change and trading range frame. The stocks of DJ Eurostoxx 50 are ordered by sector. We think that the trend is still down. The stocks will be locating in OVERSOLD territory.

Imagen del artículo

Eurostoxx 50 trading range....

Below is a table of the 50 stocks in the Eurostoxx 50. Highlight year to day (YTD) and last session % change and trading range frame. The stocks of DJ Eurostoxx 50 are ordered by COUNTRY. All Germany stocks in oversold territory. Weak pattern in Germany market.

Imagen del artículo

Asia, Europe and America...

The tables below show the list of the best and worst performing stock index and commodities. We track stock index of 29 countries. The first table shows last 5 sessions performance order stocks index hierarchy. The first left column is ordered by last 5 sessions performance.

Imagen del artículo

Ibex 35 Performance, Histograma...

Las tablas que tienen a continuación ordenan los valores de Ibex 35 desde el mejor al peor en varios plazos. La primera tabla muestra los valores de Ibex 35 ordenados según comportamiento en las últimas 5 sesiones. Además se inserta el comportamiento en la última sesión y en lo que va de año (year to … Leer

Imagen del artículo

Dow Jones Industrials Tables...

The tables below show the list of the best and worst performing stock. The first table shows last 5 sessions performance order stocks hierarchy. The first left column is ordered by last 5 sessions performance.

Imagen del artículo

Selección de 50 valores...

Seleccionamos 50 valores de Mercado Continuo y realizamos el seguimiento de su evolución en varios plazos. La primera tabla muestra esta selección de 50 valores de Mercado Continuo ordenados según el comportamiento en las últimas 5 sesiones. Además se inserta el comportamiento en la última sesión y en lo que va de año (YTD)

Imagen del artículo

DJ Eurostoxx 50 Tables...

The tables below show the list of the best and worst performing stocks. The first table shows last 5 sessions performance order stocks hierarchy. The first left column is ordered by last 5 sessions performance.

Imagen del artículo

Europe Index, Eurostoxx sectors...

The tables below show the list of the best and worst performing stock index, sectors and commodities. The first table shows last 5 sessions performance order stocks index hierarchy. The first left column is ordered by last 5 sessions performance.

Imagen del artículo

Rango de trading en...

La tabla que tienen a continuación reune los 35 valores de Ibex 35 evolucionando dentro de su rango de trading más probable. Cálculos realizados sobre el rango de trading de las últimas 150 sesiones. 10 valores continúan en sobreventa a pesar del rebote-movimiento lateral en el que llevamos instalados las últimas sesiones. Inferimos que la … Leer

Imagen del artículo

Eurostoxx 50 trading range....

Below is a table of the 50 stocks in the Eurostoxx 50. Highlight year to day (YTD) and last session % change and trading range frame. The stocks of DJ Eurostoxx 50 are ordered by sector. Sector BANKS continue in oversold territory. Spanish Bank in neutral zone. We think that the trend is still down.

Imagen del artículo

Dow Jones Industrials Tables...

The tables below show the list of the best and worst performing stock. The first table shows last 5 sessions performance order stocks hierarchy. The first left column is ordered by last 5 sessions performance.

Imagen del artículo

Asia, Europe and America...

The tables below show the list of the best and worst performing stock index and commodities. We track stock index of 29 countries. The first table shows last 5 sessions performance order stocks index hierarchy. The first left column is ordered by last 5 sessions performance.

Imagen del artículo

Ibex 35 Performance, Histograma...

Las tablas que tienen a continuación ordenan los valores de Ibex 35 desde el mejor al peor en varios plazos. La primera tabla muestra los valores de Ibex 35 ordenados según comportamiento en las últimas 5 sesiones. Además se inserta el comportamiento en la última sesión y en lo que va de año (year to … Leer

Más artículos